Herding Database Worms
by
Basil McMillan
(Click here to open a .pdf copy of this article)
Introduction
This article presents a way to structure a range of database problems that I developed while creating a moderately complex database. Although I’ve aimed for a general audience, it is suited more to those who can already develop simple databases. I found my database task difficult, frustrating, time-consuming, and a bag of worms generally – quite normal I suppose. After the worms went feral on me a couple of times, I knew I had to get them under control. Both times, I had to stop and re-invent how I thought about the problem - its architecture and what concepts underlie a database.
This work is not tied to one database system nor one problem, so I haven’t merely recounted my direct experiences. It uses structural concepts to modularise real world problems. However, for simple things – like lists of music or addresses, no real benefit is likely - and it will slow you down. In the early stages of my own database, I sought help from technical libraries and on the internet. As well, I’d previously been to a couple of short MS Access courses. I found little of use to structure my work. I suppose I looked in the wrong places - there are complex databases around that must have needed significant architectures to produce. Nevertheless, for people without access to sophisticated development systems I think this work has value.
Some may find my concepts too academic. All I can say is that for me they were an invaluable aid. I found their rigour necessary. Without them, the worms got loose and my project bogged down – with them, they still escaped, but less often and in fewer numbers.
I start this article with an overview of some basics of database structures and construction principles. A database is often an abstraction of the real world – a model. Thus a few basic modelling issues and generic problem requirements follow. Next, I identify the general concepts of a structure which can be imposed on a range of models. Finally there is an example to flesh out the conceptual skeleton.
Basics
Using MS Access features as typical of those available to readers, a database comprises the following elements:
· tables for holding data;
· queries to interrogate and re-form the data;
· forms to present and structure the data with the potential for user input;
· reports which are similar to forms, but with minimal user input, and a stronger focus on presentation structures; and
· automation facilities – macros and code.
I now see tables as representing the real-world problem. Forms and reports I see as satisfying control and management requirements – both for the database and for the problem. Queries and automation facilities translate between the two. This view helps divide the database structure conceptually, even if the final product doesn’t adhere to it completely. Importantly, the problem is modelled in the table structures and their links. Primarily this is the area that I’m addressing, although there can be spin-offs to queries and forms.
I also have some basic principles in my database design concepts:
· Minimise scope for input error by removing the need for data replication where possible. This generally means using separate tables for recurrent details.
· Assume that the user has better things to do than work out some tricky bits. This generally means providing forms that are tailored to user requirements. It also means services such as calendars, look-up lists, and calculations. As well, explanations of what forms and reports need and do on the form/report are preferable to relying on the memory or training of the user.
· Provide a database structure that allows for future development, as the original design purposes and conditions change with time.
Modelling
Databases are commonly created from a real-world problem in a specific environment. They require data to be organized and managed for a particular set of purposes/outcomes. Thus key features need to be represented, but not irrelevant or trivial ones. Also, problems can change - predictably and unpredictably. The system must therefore accept predictable changes, and be designed for future adaption to new requirements.
In simple problems, simply getting on with the job often saves time and effort. However, as complexity increases, problems rapidly become unmanageable – both in model development, and especially later when dealing with new demands. More complex problems also tend to have changing data. Thus I try to:
· break the problem down into conceptual groups;
· allow most data to change with a minimal impact on other parts of the model;
· provide a capacity to revisit the data as it was in the past;
· provide an audit trail;
· (from the basic principles) provide a capacity to implement data changes with minimal effort/impact; and
· build in a general robustness because, when I fail to live up to my own maxims from time to time, I need solutions that can cope with the failure.
Conceptual Structures
I use the term entities for real-world things, and class for the characteristics that define similar entities. A problem can have several classes. Many tables are defined from class definitions, but not all entity data are in class type tables. A class can have super- and sub- classes. Tables in each class also fall into groups that are common across classes. The following sections describe the categories that I use for data, classes, and groups.
Categories
There are 3 categories:
· Characterising data. There can only be one dataset to identify, represent, and describe an entity. Elements of its description can change from time to time. Tables holding these data, defined from classes and sub-classes belong in this category
· Numeric data need not be unique in the way that characterising data must be. Typically they are summarized in some way - totals, averages etc. Each numeric record must be linked to a characterising entity. Examples might be orders or part orders for a customer.
· All other data may fall partly into neither, either or both of the above categories. I find that linkages between characterising and numeric data can be simplified by using a table with some of the features of both groups.
Classes
Classes often have a hierarchical structure - a class may have several sub-classes. Notionally, each sub-class represents an extra dimension or range of choices. For example, a retailer (eg hardware chain) might deal with several manufacturers who may have several types of product (eg fasteners) each with several sub-products (eg nails, screws, etc each of various sizes). In this example the classes could be manufacturers, products, sub-products, and sizes. They uniquely define the characteristics of things. To run the business, the retailer needs to order product, stock it, and sell it. The amounts involved are in numeric data tables.
Groups
In defining each class, I aim to: eliminate data replication; keep together the records that show the latest state of each entity; provide an audit trail; and provide a mechanism for removing records as they become irrelevant. Thus I provide for the following types of table:
· a main table where every record defines an entity;
· secondary tables that list commonly recurring descriptive features;
· an event table that lists the reasons for each record change;
· a History table that lists main table records as they were in the past; and
· an Archive table that lists main and History records that are not actively needed, but might be needed for audit, tax, analysis, or other historical purposes. Material that can be deleted entirely should, in theory, only come from this table.
Examples
Figure 1 illustrates the characterising features (classes) and groups, of a problem with Companies (class) that have Securities (subclass) which are referenced in a Holding (subclass) associated with a Broker (class).
Figure 1.
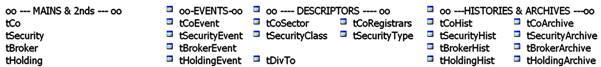
In each class, the main table provides a single record (ie a unique identifier) for each entity – Company, Security etc. There are no secondary mains here, but they might comprise special characteristics that apply to a subset of the mains, or something that doesn’t fit well elsewhere. Descriptor tables contain the limited choices that the user can make for certain fields. Importantly, choices can be extended or modified simply by adjusting the records in the table. When elements in the main table change – such as a Company name, the original record is copied to the History table. The main table record gets the new element, a new date, and an event identifying the reason for the change.
Figure 2 shows some numeric data tables. Each Holding comprises a number of parcels of varying size. When some or all of a Holding is no longer needed it is taken off the holding using a record in PclOff. The allocation of parcels to Offs is recorded in table OffAllocations.
Figure 2.
![]()
Figure 3 is a main table from category “other”. Table HoldMod links holdings and parcels. It need not be unique in its references so it is not a characterising table, but it doesn’t have anything to summarise so it is not a numeric table. As an interface it simplifies things when unique entities are merged and split. It has a number of secondary tables that record adjustments to parcel costs and sizes, and income.
Figure 3.
![]()
Conclusion
There’s not much more to say really. Even if this approach isn’t immediately relevant to you, I hope it encourages you to step back from the coalface, and see if there are other useful ways to look at your problem. Good luck!